D3 Graphs and Visualization
Experiment with many aspects of D3 for graph visualization.
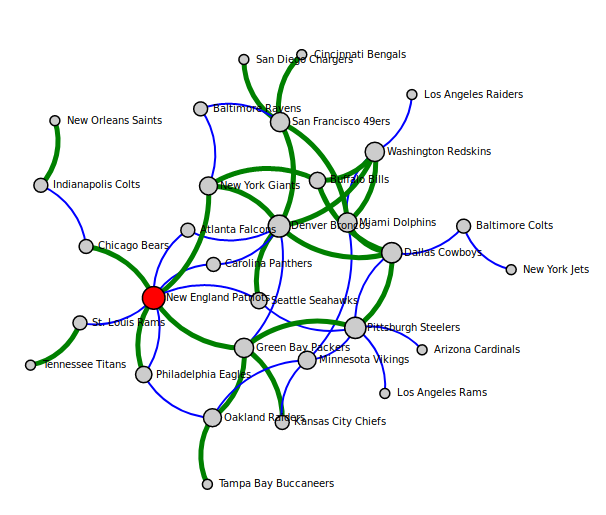
1. Force-directed graph layout
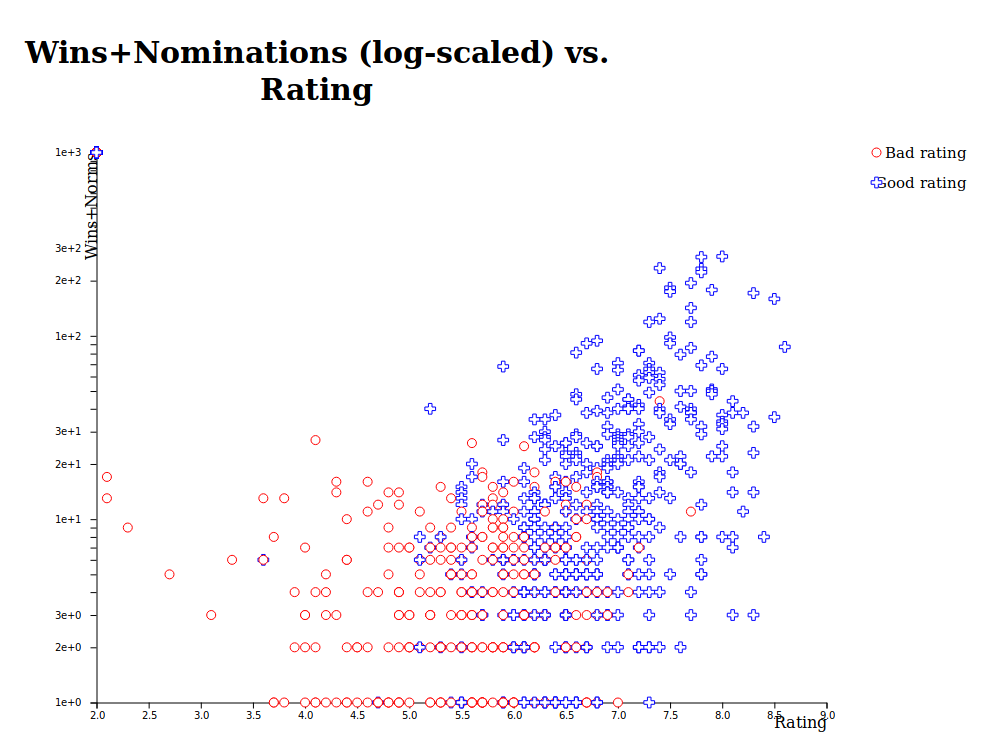
2. Scatter plots
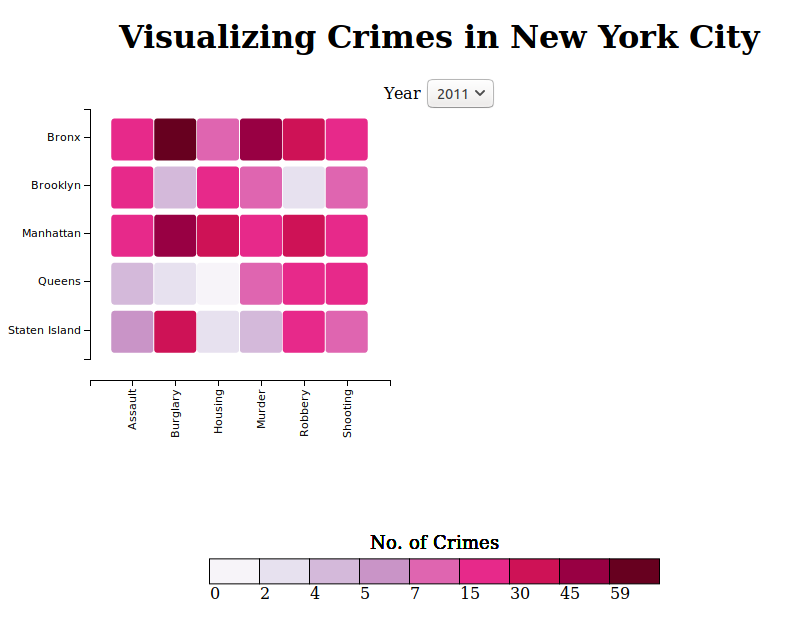
3.Heatmap and Select Box
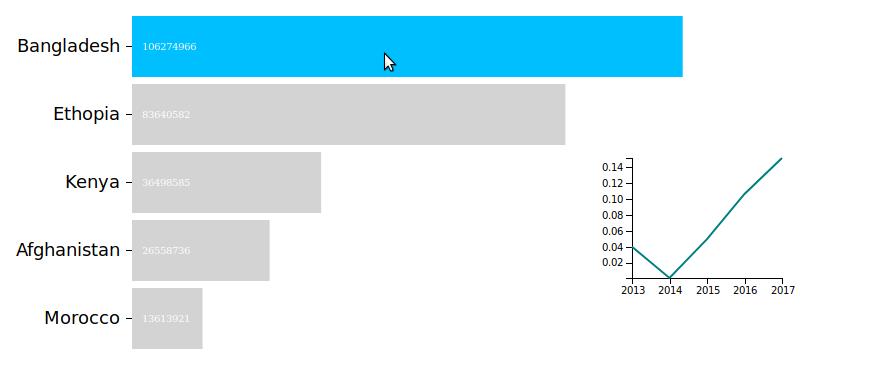
4.Interactive Visualization
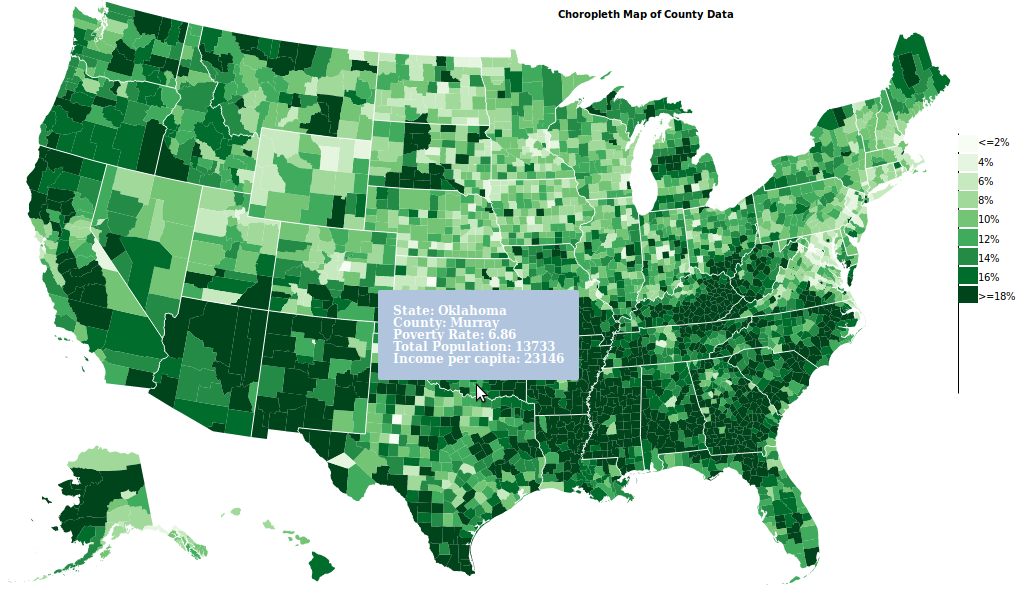
5.Choropleth Map of County Data